Uma Patterson · 17 September 2026
Mapping the Invisible: How Data Visualization Tools Reveal Hidden Patterns in Polar Ecosystem Transformations
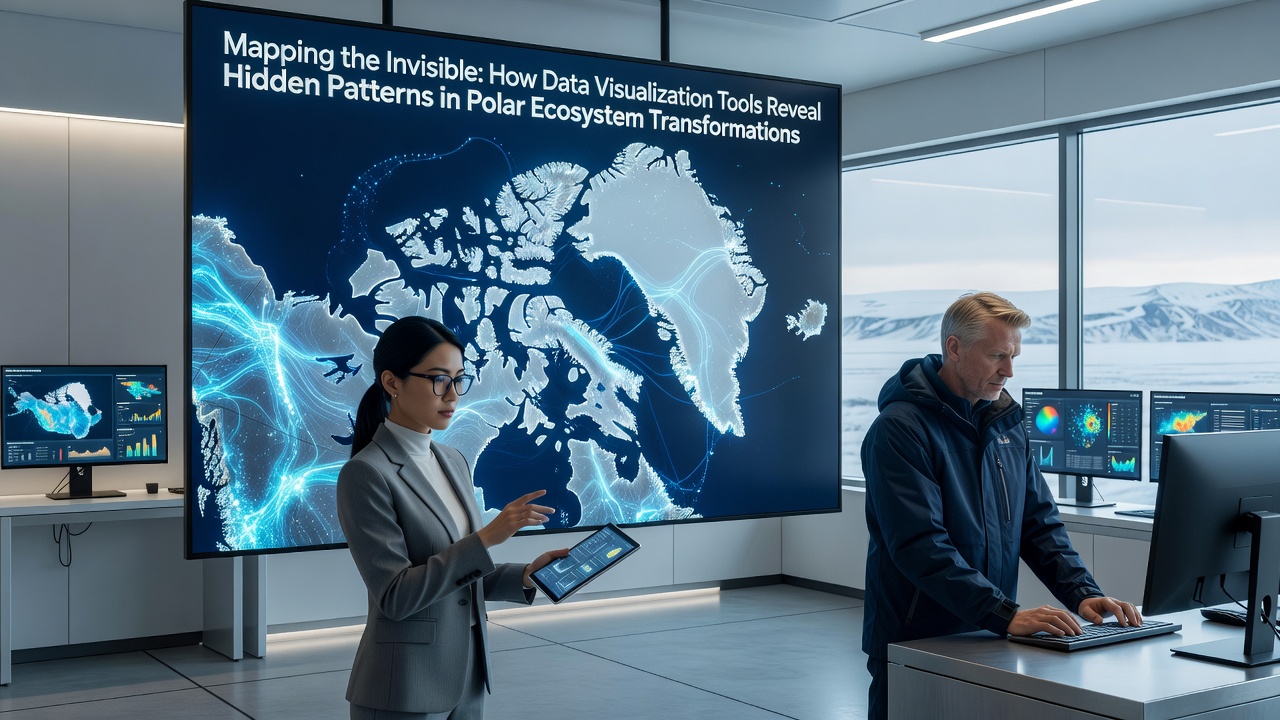
Researchers in polar regions rely on data visualization tools to translate vast datasets from satellites, sensors, and field stations into maps that show shifts in temperature, species distribution, and ice dynamics. These tools combine layers of information such as sea ice concentration, chlorophyll levels, and atmospheric readings, which allows scientists to identify correlations that remain obscured in raw numerical files. In September 2026, updated visualization platforms from international monitoring networks are scheduled to incorporate real-time feeds from new Arctic buoys, extending coverage across previously under-sampled zones.
Core Technologies Driving Pattern Detection
Geographic information systems integrate multi-source inputs from agencies including the National Snow and Ice Data Center and the European Space Agency, producing interactive layers that track chlorophyll blooms alongside ocean current vectors. Machine learning algorithms embedded in these platforms cluster data points to highlight anomalies, such as sudden shifts in penguin foraging routes or krill population density changes. Observers note that color gradients and animated timelines make seasonal transformations visible at a glance, while statistical overlays quantify rates of change across decades.
Three-dimensional renderings of bathymetric data combined with temperature profiles allow researchers to examine subsurface interactions that affect primary productivity. Tools like these process terabytes of information from autonomous underwater vehicles, revealing how warming water masses influence nutrient upwelling patterns in the Southern Ocean. Analysts apply vector field visualizations to model wind-driven ice drift, which connects surface observations to deeper ecosystem responses without requiring separate spreadsheets for each variable.
Case Examples from Recent Deployments
One research team working near the Canadian Arctic Archipelago used heat map overlays to detect unexpected alignment between declining multi-year ice and increased microbial activity in meltwater pools. The same platform flagged corridors where migratory seabirds altered paths by more than 200 kilometers over five seasons, data that aligned with satellite-derived sea surface temperature records. Those who reviewed the outputs reported that the visual clustering reduced analysis time compared with manual tabulation of individual sensor logs.
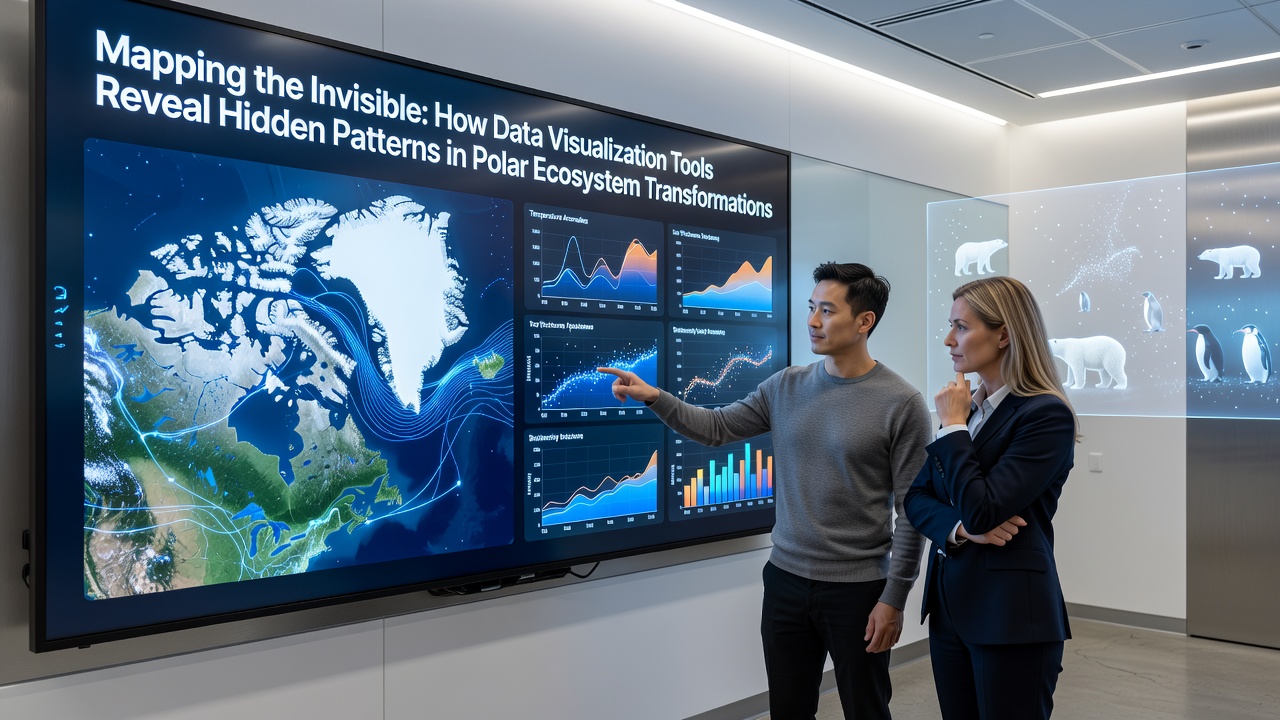
Another project focused on the Svalbard archipelago applied time-lapse animation sequences to compare glacier front positions against plankton bloom timing. The resulting sequences showed that earlier ice breakup coincided with a 15 percent advance in bloom onset dates, a relationship that became apparent only after the animation synchronized disparate datasets. Australian Antarctic Division records, accessible through open portals, supplied complementary chlorophyll measurements that confirmed the pattern across multiple fjords.
Integration of Field and Satellite Inputs
Portable tablet applications now allow field crews to upload geolocated observations directly into shared visualization environments, where they merge with satellite passes collected hours earlier. This workflow supports rapid identification of localized events, such as algal mat expansions on ice shelves or changes in seal haul-out sites. Data from the Canadian Ice Service and the British Antarctic Survey feed into the same dashboards, creating cross-regional comparisons that span both hemispheres.
Network graphs display trophic connections by linking nodes that represent predator-prey relationships with edge weights derived from stomach content analyses and acoustic surveys. When overlaid on temperature anomaly maps, these graphs expose how certain linkages strengthen or weaken as water masses shift. Researchers have applied the same approach to track contaminant transport, mapping pathways from atmospheric deposition zones to bioaccumulation hotspots in top predators.
Future Extensions and Accessibility
Upcoming releases planned for late 2026 will add augmented reality layers that project visualization outputs onto physical models of polar terrain during classroom demonstrations. Open-source libraries continue to expand options for customizing color scales and projection types, which helps accommodate datasets from high-latitude regions where standard Mercator projections distort distances. Institutions in multiple countries share code repositories that standardize metadata formats, reducing conversion steps when combining records from different sensor networks.
Conclusion
Data visualization platforms convert complex polar measurements into spatial formats that support pattern recognition across scales. Continued refinement of these tools depends on sustained contributions from satellite programs, field networks, and open data policies that keep inputs accessible for ongoing analysis.